Thomas Henson

  • Data Engineering Courses
    • Installing and Configuring Splunk
    • Implementing Neural Networks with TFLearn
    • Hortonworks Getting Started
    • Analyzing Machine Data with Splunk
    • Pig Latin Getting Started Course
    • HDFS Getting Started Course
    • Enterprise Skills in Hortonworks Data Platform
  • Pig Eval Series
  • About
  • Big Data Big Questions

Top 3 Recommendations for Real-Time Analytics

July 11, 2017 by Thomas Henson Leave a Comment

I honestly think developing real-time analytics is one of the hardest feats for developers to take on!

I’ll admit I’m for sure biased, but that doesn’t make me wrong.

My first project in the Hadoop eco-system was a real-time application when the Hadoop community still didn’t have real-time processing. I’ve always been honest in my posts and always will. So let me not sugarcoat this…the project sucked and was deemed a failure!

My team didn’t understand the requirements for real-time and couldn’t meet the requirements. The project was over budget and delayed. However, all was not lost, years have past and I learned a lot and the Hadoop community now has a new frameworks to speed up processing in real-time. Before developing your real-time analytics project please read these top 3 recommendations for real-time analytics! You will thank me….

Real-Time Analytics

What is Real-Time Analytics

Real-time analytics is the ability to analyze data as soon as it is created. Not only as soon as it’s created, but before all the data is uncovered. Traditional batch architectures have all the data in place before processing, but real-time processing is done as the data is created.

To be picky there is really no such thing as real-time analytics! What we have right now is near real-analytics which to humans is at millisecond speed or just faster than our competitors. For true real-time we would have to analyze the data at the same time it occurs and right now there is always some latency from networking, processing, etc. Let’s table this discussion until quantum computing becomes mainstream……

Take for example a GPS enabled application for brick and mortar stores. Using the phone as a sensor the application will know the customers proximity to the store. When the customer is close the store a offer is sent via the phone. Sounds simple, but imagine millions of sensors entering data into the system and trying to analyze the data location information. Add to this example for knowing store locations, store hours, local events, inventory levels, etc. Now many things could go wrong here. For example, the application could send offer for a product not in stock, send offer too late once the customer is out of range, send offer to a store that is closed.

Still think building those real-time applications is easy? Let’s look into the future…

Tsunami of Real-Time Data

How much data are we talking about for the future of real-time analytics? Gartner predicts that by 2020 worldwide we will have 20.4 billion devices connect. The predcition roughly estimates the world population of 7 billion people with an averages 3 devices per person. Sounds like a lot, however, I think it’s a conservative prediction. How many devices do you have connect in your home? I have 25 in my home and I’m not considered on the bleeding edge. I’ve talked with quite a few people who have as many as 75 plus. So let’s say 1/4 of the population has 15 devices by 2020 that will total closer to 28 plus billion devices.

Recommendations for Real-Time Analytics

Since we know why streaming processing and real-time analytics are growing at a perplexing pace, lets’ discuss recommendations for building those real-time applications.

 1 – Timing is Everything

Know the time to value for the insights of the data. All data has different values assigned to it and that value degrades over time. Picture our previous example for a retailer using location services to send offers via a mobile application. How valuable is potential customer’s location? It’s really valuable, but only if the application can process the data quickly enough to send an incentive while the customer is near their physical location. Otherwise, the application is providing historical information.

After understanding the time value of the data you can find the correct framework (Flink, Spark, Storm, etc) to process the data. Most of the streaming data we need to be processed real-time for specific insights. Example pulling that user location data and time. Remember not all data is processed the same way batch vs. streaming.

2 – Make Sure Applications will Scale

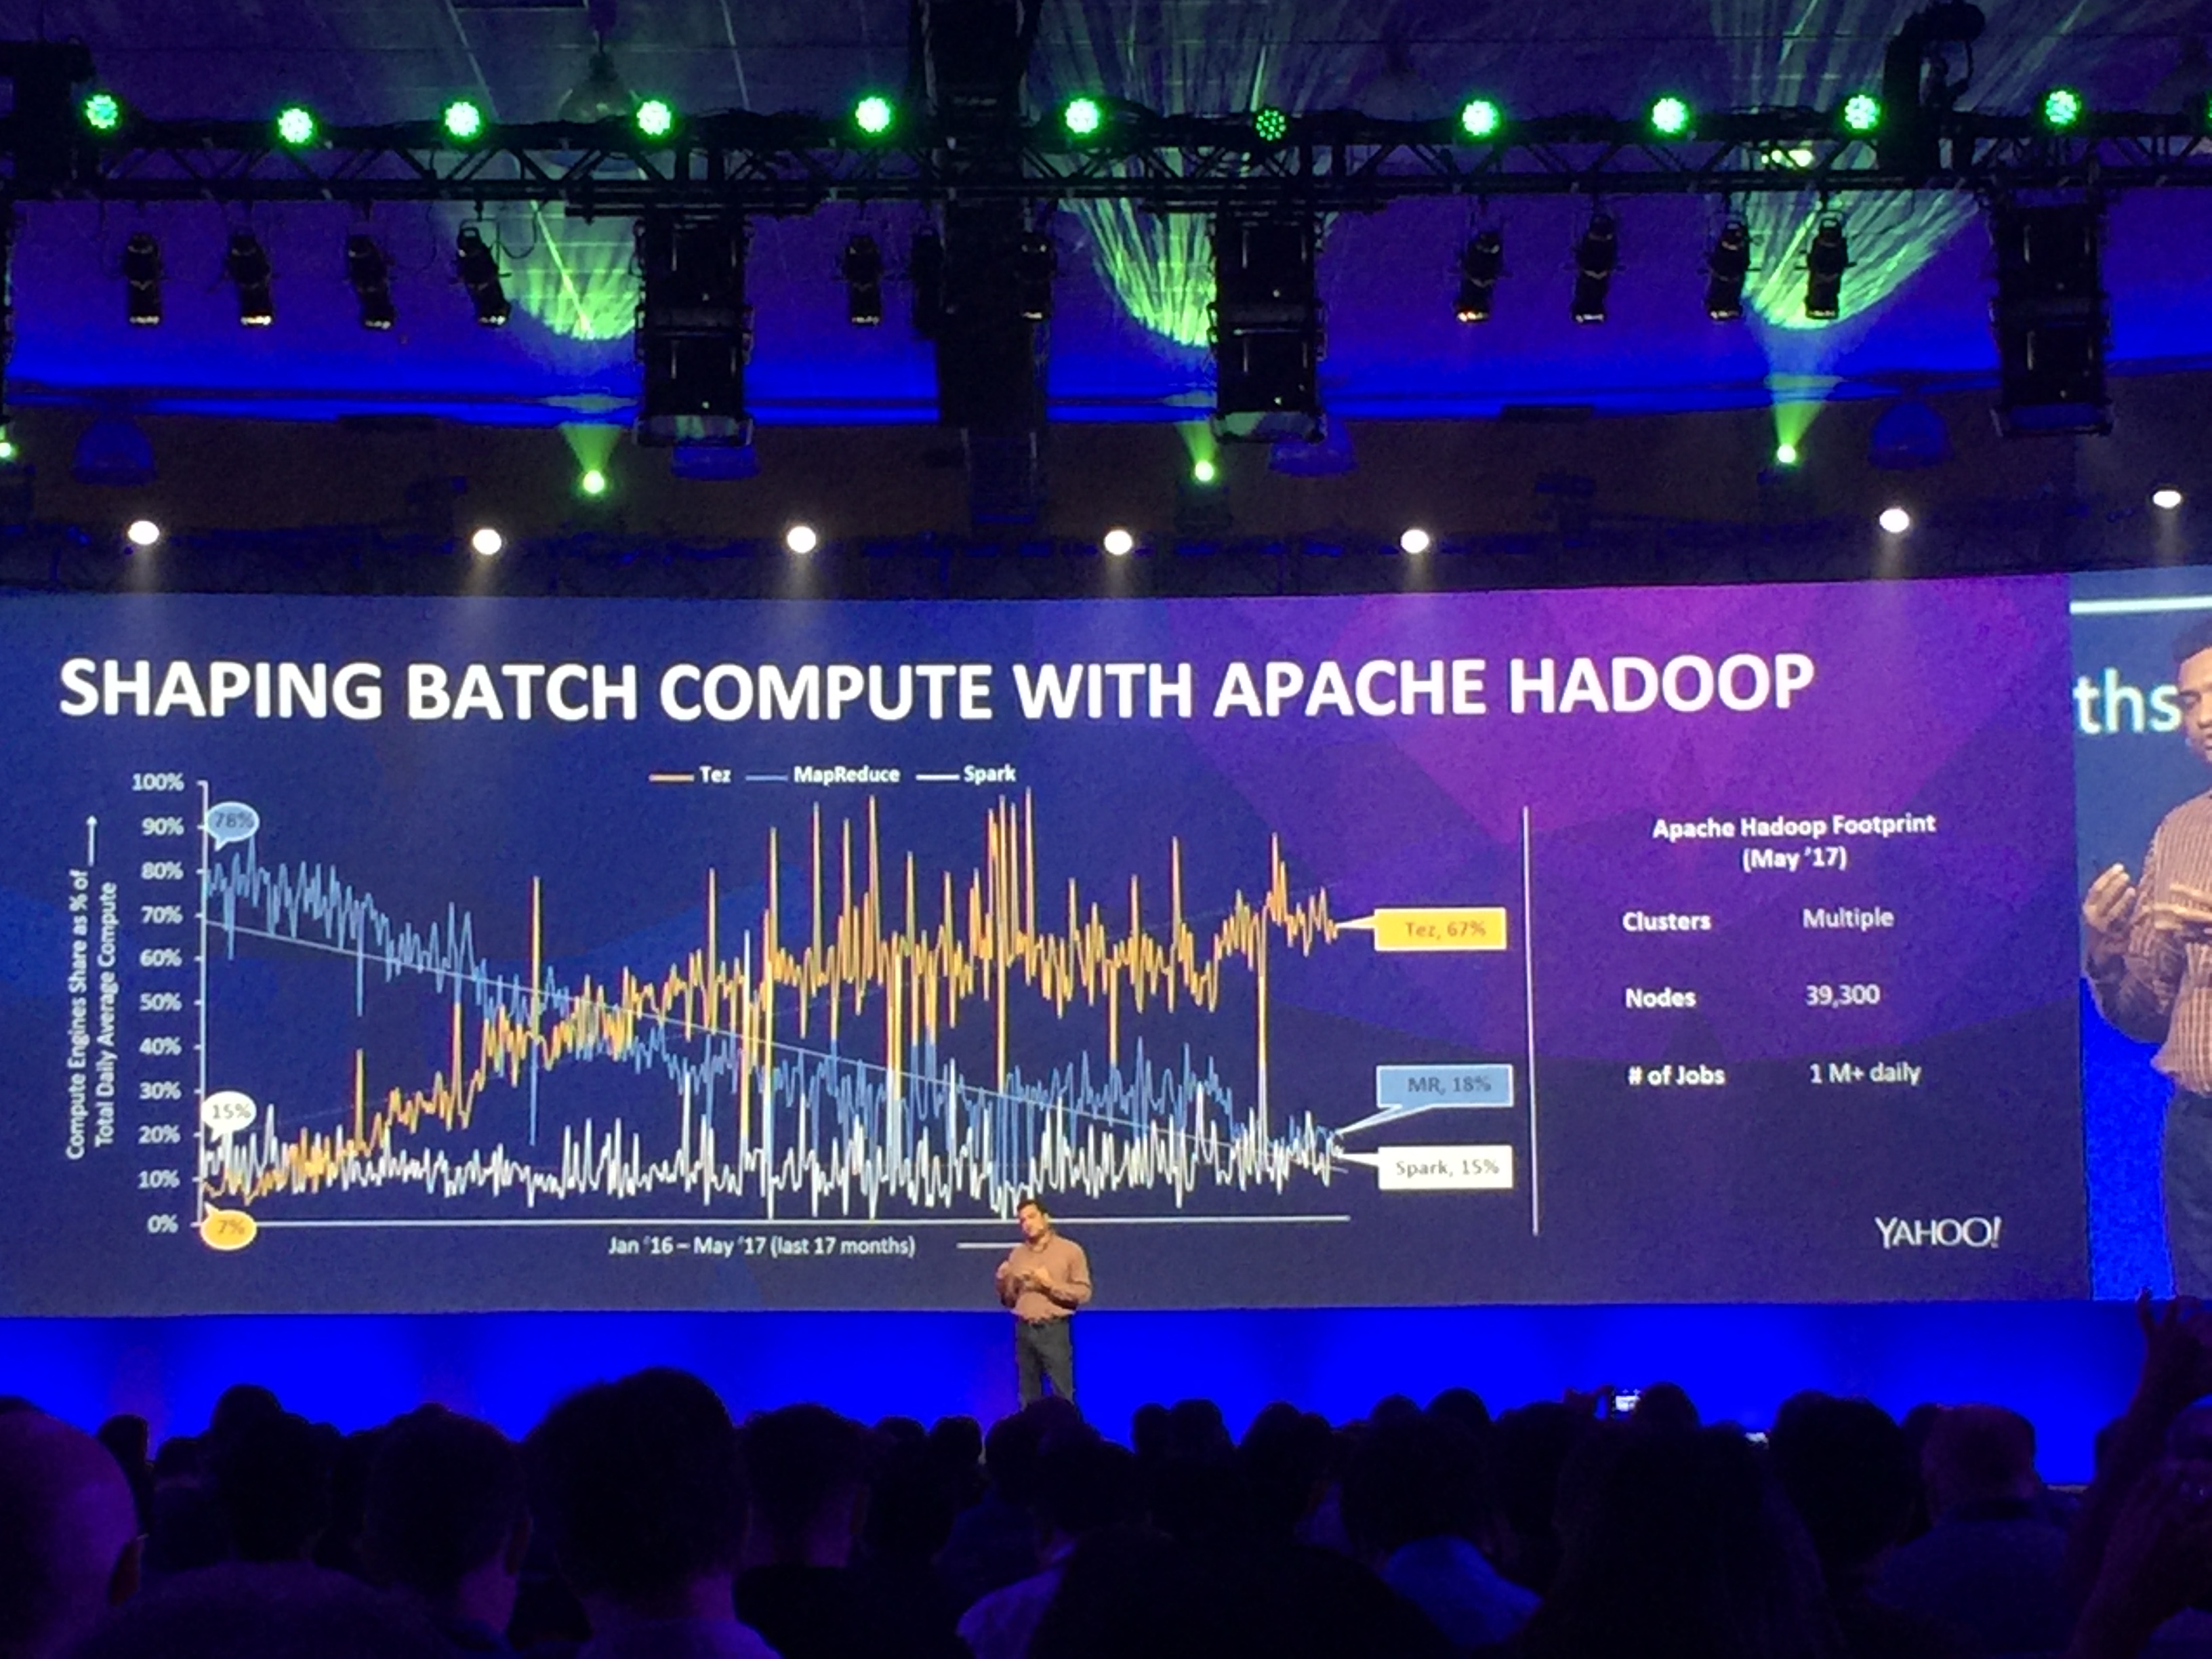
Make sure your real-time application can scale. Not just scale with large influxes of data, but independently with processing and storage. In the future of IoT and Streaming data sources will be extremely unpredictable. One day you might ingest 2 TB of new data and the next 2 PB. If you think I’m joking checkout my talk from the DataWorks Summit of the Future Architecture of Streaming Analytics. Build application on the foundation of architectures, services, and components that can scale. Remember our friend Murphy and his law about how things can go wrong.

Scaling isn’t all focused on just being able to ingest more data, but scaling independently with compute and capacity. Make sure your real-time application supports a data lake strategy. Isilon’s Data Lake Platform give the ability to separate compute and capacity when growing your Hadoop clusters. So when a new set of data comes in that is 10 TB of data that isn’t really growing and probably will only run weekly or monthly you can scale your capacity without having to add unneeded capacity. Also, a data lake strategy gives you the ability to opt out of the 3x replication with 200% utilization vs. 80% utilization on Isilon. Whether you use Isilon or not make sure you have a data lake strategy that builds on the architecture of independent scaling!!

3 – Life Cycle Cost of Data

Since we know the value of the data decrease over time we need to assign a cost for that data. I know you probably just rolled your eyes when I mentioned the cost of data, but it’s important to understand that data is a product. Just like Amazon sells books for different prices, they also assign cost data’s value varies over time

As big data developers we want to hold on to data forever and bring in as many news sources as possible. However, when our manager or CFO gets the bill for all the capacity you need you will be sitting endless meetings and writing up justification reports for about why you are holding all this data. This means less time doing what we love, coding in our Hadoop Cluster. Know the value of your data and plan accordingly!!

Wrap Up of Real-time Analytics

Finishing up our discussion, remember that real-time analytics is processing of data as soon as the data is generated. By analyzing the data as it’s generated decision can be made quicker which helps create better applications for our users.  When building real-time applications make sure you follow my 3 recommendations by understanding the time value of the data, building on systems that scale independently, and assigning value to the data. Successfully building real-time applications depends on these 3 core points.

Filed Under: Streaming Analytics Tagged With: IoT, Real-Time Analytics, Streaming Analytics

Big Data Big Questions: Big Data Kappa Architecture Explained

July 9, 2017 by Thomas Henson Leave a Comment

Big Data Kappa Architecture
Learning how to develop streaming architectures can be tricky and difficult. In Big Data the Kappa Architecture has become the powerful streaming architecture because of the growing need to analyze streaming data. For the past few years the Lambda architecture has been king but in past year the Big Data community has seen a transformation to the Kappa Architecture.

What is the Kappa Architecture? How can you implement the Kappa Architecture in your environment? Watch this video and find out!

Transcript

(forgive any errors the video was transcribed by a machine..)

Hi folks Thomas Henson here with thomashenson.com and this is another episode of big data big questions and so today what we’re going to do is we’re going to tackle the Kappa architecture and explain how we can use that in Big Data and why it’s so popular right now find out more right after this.

[Music]

So in a previous episode we talked about the lambda architecture and how the land architecture is kind of the standard that we’ve seen in big data before we had spark and streaming and Flink and you know all those processing engines that work with a you know in big data to do streaming and so you can find that video right here Oh check it out we’re in the same shirt pretty cool so after you watch that video now we need to talk about the capital architecture and the reason we’re going to talk about the Kappa is because it’s based and it’s more kind of morphed actually from what the lambda architecture is and so when we talk about the Lambda architecture we talked how we had a to dualistic you know framework so we have your speed layer and your batch or MapReduce later but more of a transactional and right so you have two layers you’re still moving your data in HDFS you’re still point your data into Q well the capital architecture what we’re trying to do there and where the industry is going is not to have to support two different frameworks right so I mean anytime you’re supporting two but two versions of code or two different layers of code it just it’s more complicated you know you mean more developers and is just more risk right you know you look at the 80/20 rule you’re always going have you know probably 20% of you know 20% of bugs cause 80% of your problems so you know why have to manage two different layers and so what we’re starting to see is we’re starting to move all our data into one system where we can interact with it through our API and you know pull out you know whether you know whether we’re running a you know flute job or whether we’re running some kind of distributed search maybe using solar or ElasticSeach but we want to collapse all that down into one different framework and so okay that that sounds pretty simple but it’s not really implemented like we think and so one of the big tips and one thing I want you to pay attention to is when you’re talking about the capital architecture you’re saying okay I’m going have all this let I’m going have this one layer here that’s going to interact and I want to run all my jobs you know whether I’m running through spark around through Flink that’s how we’re going to process this data what you want to make sure is we want to make sure that you’re not just using Kafka or some kind of message queue and you know you’re pulling your job you’re still doing you know you’re still pulling this your API’s and still running your streaming jobs from there but you may still be you know taking that data and moving it into HDFS and still running some processing here and so really what we want to see with the Kappa architecture is we want to see where we’re taking our data and you know whatever our queuing system is you can check out per Vega I oh and there’s some information there about that architecture layer and what you’ll see is you want that data to be able to you so your source data comes in you want your data to exist and it’s a kind of queuing system but then you also want that to auto to your app but you don’t want your API’s where you’re writing directly to HDFS because then you’re just writing to two different systems as well so you want something to abstract away all that storage so whether your data comes in and it’s more archival and it’s sitting in HDFS or sitting in some kind of object-based storage or it’s the streaming you know it’s the streaming applications and you’re trying to pull that data off as fast as you can you only want to interact with that one system and so that’s what we say when we talk about Kappa and that’s what Kappa really is intended to be so remember you want to abstract away that storage layer once your queuing system where you’re only dealing with API’s and so you want to be pulling your spark jobs your Flink jobs in your stripping research through one pipeline not through two different pipelines where you’re breaking up your speed layer and you’re breaking up you know maybe your batch of your transactional layer so that’s what the Kappa architecture is explained make sure you subscribe to this video so you never miss an episode you definitely want to keep up with what’s going on in Big Data any questions you have submit those big data big questions do in the comments below send me an email you know put it on the comment section or go to the Big Data big question section on my blog thanks again and I’ll see you next time.

Filed Under: Streaming Analytics Tagged With: Big Data, Hadoop Architecture, Streaming Analytics, Unstructured Data

Big Data Lambda Architecture Explained

June 29, 2017 by Thomas Henson 2 Comments

big data lambda architecture

What is Lambda Architecture?

Since the Spark, Storm, and other streaming processing engines entered the Hadoop ecosystem the Lambda Architecture has been the defacto architecture for Big Data with a real-time processing requirement. In this episode of Big Data Big Questions I’ll explain what the Lambda Architecture is and how developers and administrators can implement in their Big Data workflow.

Transcript

(forgive any errors text was transcribed by a machine)

Hi folks Thomas Henson here with thomashenson.com and today is another episode of big data big questions and so today’s question is what is the lambda architecture and how does that relate to our big data and Hadoop ecosystem? Find out right after this so when we talk about the lambda architecture and how that’s implemented into do we have to go back and look at Hadoop 1.0 and 2.0 when we really didn’t have a speed layer or Spark for streaming analytics and so back in the traditional days of Hadoop 1.0 and 2.0 we were using MapReduce for most of our processing and so the way that that would work is our data would come in we would pull our data into HDFS once our data was in HDFS we would run some kind of MapReduce job so you know we need to use pig or hive or to write our own custom job or some of the other frameworks that are in the ecosystem so that was all you know mostly transactional right so all our data had to be in HDFS so we had to have a complete view of our data to be able to process it later on we started looking at it and seeing that hey we need to be able to pull data in and do it in when data is not really complete right so unless transactional when we maybe have incomplete parts of the data or the data is continuing to be updated and so that’s where spark and Flink and some of the other streaming analytics and streaming processing engines came in is that we wanted to be able to process that data as it came came in and do it a lot faster too and so we took out the need really to even put it into HDFS for when we first we’re starting to process it because that takes time to write so we wanted to be able to move our data and process it before it even hit you know our HDFS and our disconnect that whole system but we still needed to be able to process that for batch processing right so some analytics some data that we’re going to pull we want to do that in real time right but then there’s other insights like maybe some monthly reports quarterly reports that are just better for transactional right and even when we start to talk about you know how we run a process and hold on to historical data and kind of use as a traditional enterprise data warehouse but in a larger you know more Hadoop platform basis like hi presto and some of the other SQL engines that are working on top of us do and so the need came where we were having these two different you know two different systems and how we were going to process data so we started adapting the lambda architecture so both the land architecture was was as your data come in it would sit and maybe a queue so maybe you can have it sitting in Kafka or just some kind of message queue any data that needed to be pulled out and processed streaming we would take and we will process that and what would call our speed layer so we have our speed layer maybe using smart or flee to pull out some insights and push those right out to our dashboards for our data that was going to exist for battleship for the you know transactional processing and just hold them for historical data we would have our MapReduce layer so we’re all a batch and so if you think about two different prongs so you have your speed layer coming in here pulling out your insights but your data as it sits in the cube goes into HDFS and still there to you know run hide will top up or hold on for historical data or maybe to still run some MapReduce jobs and pull up to a dashboard and so what we would have is you have two pronged approach there with your speed layer being your speed letter being on top and then your bachelor being on the bottom and then so as that dated would come in you still have your data in HDFS but you’re still be able to pull your data from you know your real time processing as the data is coming in and so that’s what we started talking about when we were saying lambda architecture is just a two layer system to be able to do our MapReduce and our best job and then also a speed layer to do our streaming analytics you know whether it be through spark flee or attaching beam and some of the other pieces so it’s a really good process to know it’s and you know it’s something that’s been in the industry for quite a long time so if you’re new to the Hadoop environment definitely want to know and be able to reference it back to but there are some other architecture that we’ll talk about in some future episodes so make sure you subscribe so that you never miss an episode so go right now and subscribe so that the next time that we talk about an architecture that you don’t miss it and I’ll check back with you next time thanks folks

Filed Under: Streaming Analytics Tagged With: Hadoop, Hadoop Architecture, Streaming Analytics

Is Hadoop Killing the EDW?

June 27, 2017 by Thomas Henson Leave a Comment

Is Hadoop Killing the EDW? Fair question since in it’s 11th year Hadoop is known as the innovative kid on the block for analyzing large data sets.  If the Hadoop ecosystem can analyze large data sets will it kill the EDW?

The Enterprise Data Warehouse has ruled the data center for the past couple of decades. One of the biggest question big data question I get is what’s up with the EDW.  Most database developers and architects want to know what is the future of the EDW.

In this video I will give my views on if Hadoop is killing the EDW!

Transcript

(forgive any errors text was transcribed by a machine)

Hi I’m Thomas Henson with thomashenson.com and today is another episode of big data big questions today’s question this made it a little bit controversial but it is big data killing the enterprise data warehouse let’s find out so is the death of universe data warehouse coming all because of big data the simple answer is in the short-term the medium-term no but it really is hampering the growth of those enterprise traditional data warehouses right and part of the reason is the deluge of all this unstructured data so 80% of all the data in the data center and in the world is all unstructured data and if you think about enterprise data warehouses they’re very structured and they’re very structured because they need to be fast right so they support our applications and I support our dashboards but when it comes to you know trying to analyze that data and trying to get that unstructured data into a structured version it really starts to blow up your storage requirements on your enterprise data warehouse and so part of the reason that the enterprise data warehouse growth is slow is because of 70% of that data that’s in those enterprise data warehouses is all really cold data so really you know only thirty percent of the data in your enterprise data warehouse is what’s used and normally that’s your newest date so that cold data is sitting there on some of your premium fast storage you know taking up that space that has your licensing fees for your enterprise data warehouse and also the premium storage and a premium hardware that is sitting on then couple that with the fact that we talked about 80% of all new data that’s coming in and data is created in the world is all in structured data right so they could clean up data from Facebook any kind of social media platforms but video and you know log files and some of your semi structured data that’s coming you know often for your Fitbit or any kind of those IOT or any of the new emerging technologies and so all this data if you’re trying to pack it into your presentation warehouse just going to explode that license fee and then also that hardware and then you don’t even know if this data has any value to it soon and that’s where big data in Hadoop and spark and that whole ecosystem comes because we can store that data that unstructured on local storage and be able to analyze that data before we need to you know put it into the dashboard or some kind of application that’s supporting it so in the long term I think that the enterprise data warehouse will start to sunset and we’re starting to see that right now but for the immediate term still you’re seeing a lot of people doing enterprise data warehouse uploads so they’re taking some of that 70% of that cold data the transfer in Hadoop environment to save on calls to the sable net licensee but also to marry that with this new data this new instruction data that’s coming in from whether it be from sensors social media or anywhere in the world and they’re marrying that data to see if they can pull any insights from it then once they have insights depending on the workload sometimes they’re pushing it back up to the enterprise data warehouse and sometimes they’re using some of the newer projects to actually use their new environment and they’re you know big data architecture to support those production you know type enterprise data warehouse applications so so that’s all we have for today if you have any questions make sure you submit up to big data big questions you can do that in the comments below or you can do it on my website thomashenson.com thanks and I’ll see you again next time.

Filed Under: Big Data Tagged With: Business, EDW, Hadoop

DataWorks Summit 2017 Recap

June 19, 2017 by Thomas Henson Leave a Comment

All Things Data

Just coming off an amazing week with a ton of information in the Hadoop Ecosystem. It’s been a 2 years since I’ve been to this conference. Somethings have changed like the name from Hadoop Summit to DataWorks Summit. Other things stayed the same like breaking news and extremely great content.

I’ll try to sum up my thoughts from the sessions I attended and people I talked with.

First there was an insanely great session called The Future Architecture of Streaming Analytics put on by a very handsome Hadoop Guru, Thomas Henson. It was a well received session where I talked about how to architect streaming application for the next 2-5 years where we will see some 20 billion plus connected devices worldwide.

DataWorks Summit 2017 Recap

Hortonwork & IBM Partnership

Next there was breaking news with Hortonworks and IBM partnerships. The huge part of the partnership was that IBM’s BigInsights will merge with Hortonworks Data Platform. Both IBM and Hortonworks are part of the open data platform .

What does this mean to the Big Data community? Well more consolidation of Hadoop distros packages, but more collaboration into the big data frameworks. This is good for the community because it allows us to focus on the open-source frameworks inside the big data community. Now instead of having to work though the difference of BigInsights vs. HDP, development will be poured into Spark, Ambari, HDFS, etc.

Hadoop 3.0 Community Updates

New updates coming the with the next release of Hadoop 3.0 was great! There is a significant amount of changes coming with the release which is slated for GA August 15, 2017. The big focus is going to be with the introduction of Erasure Coding for data striping, supporting containers for YARN, and some minor changes. Look for an in-depth look at Hadoop 3.0 in a follow up post.

Hive LLAP

If you haven’t looked deeply at Hive in the last year or so….you’ve really missed out. Hive is really starting to mature to a EDW  on Hadoop!! I’m not sure how many different breakout sessions there were on Hive LLAP but I know it was mentioned in most I attended.

The first Hive breakout session was hosted by Hortonworks Co-founder Alan Gates. He walked through the latest updates and future roadmap for Hive.  Also the audience was posed a question: What do we except in a Data Warehouse?

  • Governance
  • High Performance
  • Management & Monitoring
  • Security
  • Replication & DR
  • Storage Capacity
  • Support for BI

We walked through where the Hive community was in addressing these requirements. Hive LLAP was certainly there on the higher performance. More on that now….

Another breakout session focused on a shoot off for the Hadoop SQLs. Wow this session was full and very interesting. Here is the list of SQL engines tested in the shoot out:

  • MapReduce
  • Presto
  • Spark SQL
  • Hive LLAP

All the test were run using the Hive Benchmark Testing on the same hardware. Hive LLAP was the clear winner with MapReduce the huge loser (no surprise here). The Spark SQL performed really well but there were issues using the thrift server which might have skewed the results. Kerberos was not implemented on the testing as well.

Pig Latin Updates

Of course there were sessions on Pig Latin! Yahoo presented their results on converting all Pig jobs from MapReduce to Tez jobs. After seeing the keynote about Yahoo’s conversation rate from MapReduce jobs to Tez/Spark/etc jobs shows that Yahoo is still running a ton of Pig jobs. Moving to Tez has increased the speed and efficiency of the Pig jobs at Yahoo. Also in the next few months Pig on Spark should be released.

DataWorks Summit 2017 Recap

Closing Thoughts

After missing last year at the Hadoop Summit or DataWorks Summit it was fun to be back. DataWorks Summit is still the premier events for Hadoop developer/admins to come and learn new features developed by the community. For sure this year the theme seemed to be benchmark testing, mix between Streaming Analytics, and Big Data EDW. It’s definitely an event I will try to make again next year to keep up with the Hadoop community.


Filed Under: Big Data Tagged With: DataWorks Summit, Hadoop, Streaming Analytics

Isilon Quick Tips: Compare Snapshots in OneFS

June 10, 2017 by Thomas Henson Leave a Comment

Compare Snapshots in OneFS
How to Compare Snapshots in OneFS

At least once every Isilon Administrator will need to compare snapshots in OneFS. It might be a situation where a user has upload files to the wrong directory or you need to roll back to a different version of a directory. Whatever the case OneFS has the ability to compare snapshots from the CLI>

In this episode of Isilon Quick tips I will walk through using the CLI to view and compare snapshots in OneFS. Watch this video and learn how!

Transcript

(forgive any errors it was transcribed by a machine)

Hi and welcome back to another episode of Isilon quick tips! Today we’re going to talk about how to compare some snapshot images all from the CLI find out more right after this.

In this episode what we want to do is we want to look at some snapshots and see how we can compare these snapshots.  So you can see here from the Web CLI I have a lot of snapshots but if I wanted to compare them how can I do that?  Look do all that from the command line so  SSH back into our cluster.

The first thing we’re going to do is we’re going to list out all of our snapshots you can see that all of our snapshots are here so all my snapshots are on this ifs NASA directory and you see that I have an ID here that specifies each one and then also I have a default name here for the snapshot schedule name and so if we wanted to compare a couple of these so what is the difference between our first snapshot so ID two and let’s just say that we wanted to compare it with ID 20 what would be the difference between those two and so there’s a way that we can actually compare that the first thing we want to do is let’s just look and see what information is available if we just view that individual ID number so we can use our easy snapshot snapshots view and then just put in the ID number you can also put in the name but I have a default name that’s very long so it’s just easier for me with managing the smaller data set to just use that ID number so let’s see what information is available here and so it gives us our path and our name it’s also going to tell us how much space is holding up and when the snapshot was created if it’s law or if it’s going to expire but there’s not a lot of information in telling us what’s actually in it right because it’s just a snapshot of a point in time and so how do we compare this so we want to take our snapshot ID number two and let’s compare it to number 20 and see what data has changed and so to do that we’ll be using a change list modification but to do that we’ll have to kick off a job to start it so I’m going to clear out the screen and let’s type in our easy job and so what we’ll do is we’ll do an easy job jobs start and we’re going to create a change list and so that’s changed list we’re going to put in the old snap ID so the old snap ID was two and we’re going to compare it with our newer snap and so the newer snap ID was 20 so we started the job and so if we wanted to go out and list it out let’s go ahead and view our change list so we use easy change list modification and we’ll just use L to list out all our change lists we have a change list here for to underscore 20 and so this is going to be the change list that we just created that’s comparing ID 2 and ID 20 sometimes you’ll get an in progress at the end and that’s just because the job is still processing and so you can’t view it just yet so just come back and check in a few different times but it looks like our jobs complete here so we can view those so to view it we’re just going to use – a instead of L and that ID number so to underscore 20 so easy change list mod – a to underscore 20 so we have a lot of information that’s compared in this change modification between snapshot 2 and snapshot 20 one of the big things is we have two files that were created here that I was looking for so this is NASA I uploaded a facility’s CSV then I also uploaded a report CSV and so you can see some of the timestamps or some of the other information but if you’re looking at this information you’re saying man this it’s kind of hard to look at what’s really the objective here well this is a way that we can look and look at this change modification date from the CLI but for the most part this is really used by some other applications order through the Isilon onefs api to be able to pull that information out so if you’re looking to write some kind of process that’s going to look and compare these changes to move some of the backups then you would use this so the best way to look and see what all these different CLI flags and some of these path names are is to go back and look at the Isilon documentation so if you look at the Isilon documentation you can see what all these flags mean here so that if you’re writing some kind of code or some kind of application that’s using the API to kind of do a backup process or something like that then you can use this information here but if you’re just looking quickly on how you want to see what changes happen between two different snapshots you can definitely just use this and pull out some information like I said the biggest thing for me is I wanted to see the different path names so I wanted to see were there any files that are different in snapshot two versus snapshot twenty and we’re able to see that here be sure to subscribe so that you never miss an episode of Isilon quick tips and see you next time [Music]

Filed Under: Isilon Tagged With: Isilon, Isilon Quick Tips, OneFS, Snapshots

DataWorks Summit: Future Architecture of Streaming Analytics

June 5, 2017 by Thomas Henson 1 Comment

Ready to learn about the Future Architecture of Streaming Analytics?

Next week I will be heading to the DataWorks Summit in San Jose (formerly Hadoop Summit). The DataWorks summit is one of the top conferences for the Hadoop Ecosystem. Last year was first DataWorks Summit I’ve missed the past 3 years, but this year I’m back. I’m happy to announce this year I have a breakout sessions.

My session will focus on the Future Architectures of Streaming Analytics. I will cover how these architectures will support the future of Streaming Analytics. In the past few years the Hadoop community has focused on the processing of data from streaming data sources with Storm, Spark, Flink, Beam and other projects. Now as we enter in era of massive streams of data it’s time to focus on how we store and scale theses systems. Gartner predicts that by 2020 we will reach 20.4 billion connected devices. Now more than ever we are going to need systems with auto-scaling and unlimited retention. Projects like Pravega emerging to abstract away the storage layer in massive data analytics architectures. Stop by my session to learn about Pravega and architecture recommendations for Streaming Analytics.

Future Architecture of Streaming Analytics

Information on my session

 Future Architecture of Streaming Analytics: Capitalizing on the Analytics of Things (AoT)

The proliferation of connected devices and sensors is leading the Digital Transformation. By 2020 there will be over 20 billion connected devices. Data from these devices need to be ingested at extreme speeds in order to be analyzed before the data decays. The life cycle of the data is critical in revealing what insight can be revealed and how quickly they can be acted upon.

In this session we will look at the past, present and future architecture trends of streaming analytics. Next we will look at how to turn all the data from these devices into actionable insights. We will also dive into recommendations for streaming architecture depending on the data streams and time factor of the data. Finally, we will discuss how to manage all the sensor data, understand the life cycle cost of the data, and how to scale capacity and capability easily with a modern infrastructure strategy.

When: Tuesday June 13th 3:00 PM 

Where: Ballroom C

Filed Under: Streaming Analytics Tagged With: Conference, DataWorks Summit, Streaming Analytics

Big Data Big Questions: Do I need to know Java to become a Big Data Developer?

May 31, 2017 by Thomas Henson 1 Comment

know Java to become a Big Data Developer

Today there are so many applications and frameworks in the Hadoop ecosystem, most of which are written in Java. So does this mean anyone wanting to become a Hadoop developer or Big Data Developer must learn Java? Should you go through hours and weeks of training to learn Java to become an awesome Hadoop Ninja or Big Data Developer? Will not knowing Java hinder your Big Data career? Watch this video and find out.

Transcript Of The Video

Thomas Henson:

Hi, I’m Thomas Henson with thomashenson.com. Today, we’re starting a new series called “Big Data, Big Questions.” This is a series where I’m going to answer questions, all from the community, all about big data. So, feel free to submit your questions, and at the end of this episode, I’ll show you how. So, today, the first question I have is a very common question. A lot of people ask, “Do you need to know Java in order to be a big data developer?” Find out the answer, right after this.

So, do you need to know Java in order to be a big data developer? The simple answer is no. Maybe that was the case in early Hadoop 1.0, but even then, there were a lot of tools that were being created like Pig, and Hive, and HBase, that are all using different syntax so that you can extrapolate and kind of abstract away Java. Because the key is, if you’re a data analyst or a Hadoop administrator, most of those people aren’t going to have Java skills. So, for the community to really move forward with this big data and Hadoop, we needed to be able to say that it was a tool that not only Java developers were going to be able to use. So, that’s where Pig, and Hive, and a lot of those other tools came. Now, as we start to look into Hadoop 2.0 and Hadoop 3.0, it’s really not the case.

Now, Java is not going to hinder you, right? So, it’s going to be beneficial if you do know it, but I don’t think it’s something that you would want to run out and have to learn just to be able to become a big data developer. Then, the question is, too, when you say big data developer, what are we really talking about? So, are we talking about somebody that’s writing MapReduce jobs or writing Spark jobs? That’s where we look at it as a big data developer. Or, are we talking about maybe a data scientist, where a data scientist is probably using more like R, and Python, and some of those skills, to pull their insights back? Then, of course, your Hadoop administrators, they don’t need to know Java. It’s beneficial if they know Linux and some of the other pieces, but Java’s not really necessary.

Now, I will say, in a lot of this technology… So, if you look at getting out of the Hadoop world but start looking at Spark – Spark has Java, so you can write your Spark jobs in Java, but you can also do it in Python and Scala. So, it’s not a requirement for people to have Java. I would say that there’s a lot of developers out there that are big data developers that don’t have any Java skills, and that’s quite okay. So, don’t let that hinder you. Jump in, join an open-source community project, do something to expand your big data knowledge and become a big data developer.

Well, that’s all we have today. Make sure to submit your questions. So, I’ve got a space on my blog where you can submit the questions or just submit them here, in the comments section, and I’ll answer your big data big questions. See you again!


Filed Under: Big Data Tagged With: Big Data, Big Data Big Questions, Hadoop, Learn Hadoop

Complete Guide to Splunk Add-Ons

May 24, 2017 by Thomas Henson Leave a Comment

Splunk is a popular application for analyzing machine data in the data center. What happens when Splunk Administrators want to add new data sources to their Splunk environment outside the default list?

The Administrators have two options:

  • First they can import the data source using the regular expression option. Only fun if you like regular expressions.
  • Second they can use a Splunk Ad-On or Application.

Let’s learn how Splunk Add-Ons are developed and how to install them.

Splunk Add-Ons

How to Create Splunk Plugins

Developers have a couple of options to create Splunk Application or Add-Ons. Let’s step through the options for creating Splunk Add-Ons by going from the easiest to hardest.

The first option to create a Splunk Add-Ons is by using the dashboard editor inside the Splunk app. Using the dashboard editor you can create custom visualizations of your Splunk data. Simply click to add custom searches, tables, and fields. Next save the dashboard and test out the Splunk Application.

The second option developers have is to use XML or HTML markup inside the Splunk dashboard. Using either markup language gives developers more flexibility into the look and feel of their dashboards. Most developer with basic HTML, CSS, and XML skills will choose this option over the standard dashboard editor.

The last option inside the local Splunk environment is SplunkJS. Out of all the option for creating application in the local Splunk environment SplunkJS allows the greatest control for developing Splunk applications. Developer with intermediate JavaScript skills will find using SplunkJS fairly easy while those without JavaScript skills will have a more difficult time.

Finally for developers who want the most control and flexibility for their Splunk Ad-Ons Splunk offers Application SDK options. These applications leverage the Splunk API and allow for developer to write the application in their favorite language.   By far using the SDK is the most difficult but also creates the ultimate Splunk Application.

Splunk Application SDK options:

  • Javascript
  • C#
  • Python
  • Java

What is Splunkbase

After developers create their applications they can then be uploaded to the Splunkbase. Splunkbase is the de facto marketplace for Splunk Add-Ons and applications. It’s a community driven market place for both licensed (paid) and non-licensed (not paid) Splunk Ad-Ons and Applications. Splunk certified applications ensure  secure and mature Splunk Applications.

Think of Splunkbase as Apple’s App store. Users download applications that run on top of iOS to extend the functionality of the iPhone. Both the community and corporate developers build Apple’s iOS Apps. Just like the iOS App store, Splunkbase offers both paid and free applications and Ad-Ons as well.

How to install from Splunkbase

The local Splunk environment integrates with Splunkbase. Meaning Splunkbase install are seamless. Let’s walk through a scenario below installing the Splunk Analytics for Hadoop in my local Splunk environment.

Steps for Installing App from Splunkbase:

  1. First log into local Splunk environment
  2. Second click Splunk Apps
  3. Next browse for “Splunk Analytics for Hadoop”
  4. Click Install & enter log in information
  5. Finally view App to begin using App

Another option is to install directly to the local Splunk environment. Simply download application directly and upload to local Splunk environment. Make sure to practice good Splunk hygiene by only downloading trusted Splunk Apps.

Closing thoughts on Splunk Apps & Add-Ons

In addition to extending Splunk, Add-Ons increase the Splunk environment’s use cases. The problem with Splunk is as user begin using they want to add new data sources. While often the new data sources are supported, times when data sources aren’t default Splunk’s community of App developers fill that gap. Splunk’s hockey adoption comes from the ability to add new data sources. New insights are constantly pushing new data sources in Splunk.

Looking to learn more about Splunk? Checkout my Pluralsight Course Analyzing Machine Data with Splunk.


Filed Under: Splunk Tagged With: Data Analytics, IT Operations, Splunk

Isilon Quick Tips: Deep Dive FTP

May 17, 2017 by Thomas Henson Leave a Comment