Thomas Henson

  • Data Engineering Courses
    • Installing and Configuring Splunk
    • Implementing Neural Networks with TFLearn
    • Hortonworks Getting Started
    • Analyzing Machine Data with Splunk
    • Pig Latin Getting Started Course
    • HDFS Getting Started Course
    • Enterprise Skills in Hortonworks Data Platform
  • Pig Eval Series
  • About
  • Big Data Big Questions

Data Engineer LinkedIN Profile

May 17, 2019 by Thomas Henson Leave a Comment


Data Engineer LinkedIN Profile

How Connect with Data Engineering Community on LinkedIN

When it comes to professional networking and social media LinkedIN is king! However, does it make sense for Data Engineers and Data Scientist to embrace LinkedIN? The simple answer is if you are not on LinkedIN you are missing a huge opportunity to network and get involved in the Data Analytics community. In this episode of Big Data Big Question we explore how to utilize LinkedIN for build a career in Data Engineers. Also we dig into tips for optimizing your Data Engineering or Data Scientist profile on LinkedIN. Watch the video below to learn how to amplify your reach in Data Engineering community.

Transcript Data Engineer LinkedIN Profile

Hi, folks! Thomas Henson here with thomashenson.com, and today is another episode of Big Data Big Questions. You’re probably wondering. Where the heck am I? Actually, on the other side is my office. I thought this would be a good opportunity for me just to record in a different location. New year, how about some new places to record? This is my gym that I’m continually building up over the years. New view. Today, what we’re going to talk about, this is a Big Data Big Question comes in. It’s all around how do you build a LinkedIn profile for a data engineer? Specifically, how do I build it if I’m in that role today, or how do I build it if, I don’t really have work experience? Are there some things that I can do? All while staying honest, right? I’m not giving you tips to say, “Hey, use this term even if you haven’t done it.” Those are all going to be some tips for us, and then make sure you stick around to the end. I’ll go through and show you what I’ve done on some of my LinkedIn profile, too. I’ll show you how I’ve stacked some projects, and added some videos, and other kinds of content that can help you stay in the community. We’re going to break everything done, and we’re going to talk about specifically for your LinkedIn profile as a data engineer, the things that you can control. The areas that you control. There are some things you can’t control, and we’ll talk about those a little bit.

The first thing is your title. You can come up with an awesome title. Obviously, try to keep it relevant. Don’t say you’re a data engineer if you’re not a data engineer, but you can be a data enthusiast. I’ve seen people talk about they’re data ninjas or data gurus. I’ve even seen somebody for a while that, actually right out of, I think they graduated like a year before I did, and they’re background was Excel, and they were an Excel, I think they did Excel Ninja, and that’s how they got their first role outside. It was not a data engineering role, but it was actually a developing role that came into GIS or something like that. You can get creative with that. You can go through, and you can also look at seeking opportunities. I’ve seen people that have put what they’re seeking there. Control that title. The next area, number two, that you can control, is your work experience. To some extent, right? If you don’t have work experience, there’s some things you can’t do there. You can put work experience from, come on? Come on? Open source projects, right? You can become a contributor. You can move your way up in those areas, and that can give you an opportunity to be able to add some things in there. If you do have work experience, put those in there. Make sure you’re putting your daily tasks, especially anything that’s data related, like if you’re doing stuff with SQL, you’re doing stuff with development, whether it be C# or BB. You can go back and look at my profile and see where I was a .NET developer. Put those tasks.

Then, also, find other tasks that maybe you’ve done some research. One of the things that I had to do was, I had to do research on different things. When we were moving, like I said, I was a web developer moving into the data engineering role. At the time, it was somewhat of a conscious effort, but not some, as well, too. I volunteered to get on a project, and so some of the things that I had to do was the research. Looking through Horton Works, looking through Cloudera, the Sandbox, going through and standing up our own Hadoop platform, and just testing those things out. That’s all valid. That might not be my day to day task. I didn’t do it the whole time I was there, but that was one of the things that I was tasked with doing, and even as small as that sounds, put that on there. That gives you more experience and, if somebody’s looking at your LinkedIn profile, goes, “Hey, man,” this person is moving into that role. They have this experience there. Another thing is, if you attended any conferences, there, too. That was another thing that I was very fortunate in my role, where it was like, “Hey, love to get into this, Mr. Customer.” We signed up for a big project. There’s a couple of conferences that I needed to attend to get skilled up.

Hadoop [Inaudible 00:03:48] some of them. You’ve probably seen me wearing, this one’s not it, but you’ve seen me wearing some of the hoodies from Hadoop conference. We’ll put those conference attendance in there, especially if you’ve spoken at any or anything like that. You can put project stuff in there. You’ll see it on my profile, but if you’ve done anything, even if you’ve made a simple demo or something like that, make sure it’s customer, it’s public-facing. Don’t put any information from a company you’re not supposed to, but you can actually add projects to it. Whether it’d be a link to a blog post that you wrote for your company or for a project that you’re on, or video. I’ve made some videos on my personal site, and you’ll see those here. I’m going to show you my profile.

Number three that you can control, there’s some things we can control about that work experience. Then, here we can control the education. If you have a college degree, if you have anything from that nature, even certifications. There’s a little section for certifications. Those are things that you can control. Controlling that, I’m not saying put that you went to MIT if you didn’t go to MIT, right? This is not going to help you. Short-term it might get you an interview, but that’s not the long game we want to play, and that’s just not the right thing to do. Make sure. I’m talking about, you can control it from the aspect of, “Hey,” if you’re planning on going to college, you have an anticipated graduation date, I would home in on that, and any kind of honors, projects, or denotations you’ve had in there, include that in your education section. Those are longer-term, but I’m saying, you can control it, because you can determine today what themes you’re going build on, what you’re going to do during your college and your education experience. It’s a long-term thing, right? Most of them are four years, five years, however long it takes you. Took me longer. Maybe I’ll do another video someday on how long it actually took me. Either way, you’re going through your education, the factors that you can control. Make sure you’re putting that on there. Short-term, we’ve talked about this [Inaudible 00:05:48] short-term still in education. You can control the certifications. We know what my goals are for 2019 as far as certifications and the certifications that I’m trying to knock out. Those are short term that you can. They have them with the [Inaudible 00:06:01] they have them with Coursera. Other education sites, and then there’s also the vender-specific. AWS, Horton Works, Cloudera, specific certifications that you can go through. You can start adding that, and that scenario where, with work experience it’s a little harder. With education, traditional four-year college, a little harder. I little long-term to go, but those, if you’re really fighting to take that next role or move into a role, whether it be within your company, whether you’re trying to, you’re a consultant trying to bring in more projects, go through some of those certifications. That’s something that you can tackle, and just depending on your knowledge base, something anywhere from one month to six months, you can knock out some of those certifications that are really going to help you build out that LinkedIn profile as a data engineer.

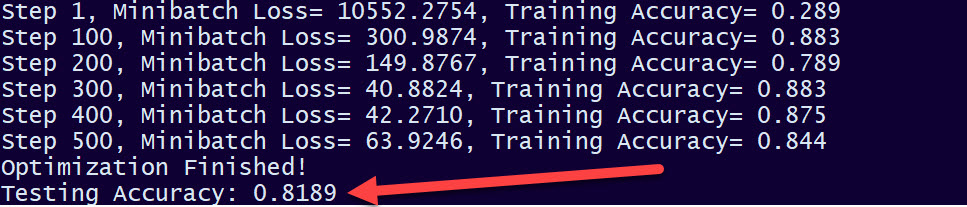
The last area that you can control. You control title, you can control the work experience, you can control your education and certifications. Activity. You have the most control, and you can pause this video and go post a relevant topic right now, assuming you have a LinkedIn profile, which if you don’t, I think it’s going to be very important to you. You should get one. You can control that activity. You can control what you do from a hashtag perspective. What you want to put out there as far as, hey, if you go and look at my site, you’ll see some of the things that I’m learning and I’m going through. Not only on my YouTube channel does everybody get to see behind the scenes of what I’m looking at, but more importantly, you can start to mold that, and pull that part into your education. From my perspective, you can see, for a good part of last year, I was really working on doubling down into deep learning and understanding what’s going on in that community from a Tensorflow perspective, [Inaudible 00:07:46] perspective, from a PyTorch, or just what the heck does a C&N mean? You can see it slowly evolving my education and sharing that knowledge, and same thing there. You control that activity, but it’s not a one-way street. You’re not trying to just put stuff out here. You want to be [Inaudible 00:08:03] communities, too. You want to like and comment on some of your peers and other people around that are interested in the same things that you’re interested in, too.

About to roll into my last section. That was the mailperson. Talked about how you can put in, how you can add projects, add experience, and really beef up your LinkedIn profile, specifically for data engineers, machine learning engineers, Hadoop developers, that whole ecosystem. Now, let’s take a look real quick at my profile. I promise that, if you stuck around, I’d show you. As we’re going through this, just check out here on the experience. This is what I was talking about. Whenever you’re looking at what you’ve specifically done for a job, and what’s your day to day task card, this is where you get to put in your experience. You can see here, not only do I have my day to day task and even some of what my day to day tasks might be, and what my job description is, but also some other things I’ve been involved with, like conferences spoke at. You can see here where I brought in projects. Whenever I do demos and some of these other things, even on my site, it’s good to be able to link it here and show those as projects, show people, hey, these are some of the things I’ve done. Same thing with conferences. I’ve had some conferences I spoke at, at other places, and this is how I roll.

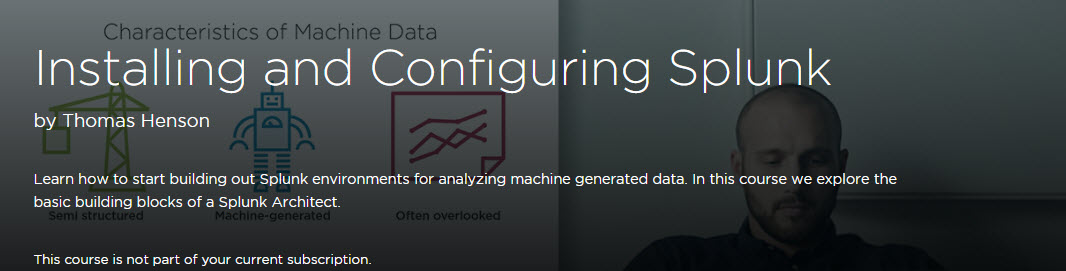
You can see here too, from a Pluralsight perspective, this is one thing that I got involved with Pluralsight, and just love to be able to have this in my profile. This shows that in the industry, I’m taking this to heart, and not only am I doing this, and furthering my knowledge, but I’m giving back and helping others, too. This gives me that opportunity to be able to do it. Everybody here has that opportunity. As you’re learning things, document it, make videos. Do things to be a part of the community and be able to show on your profile. The next thing, the activity, here. Look at some of the activity. You can see there’s definitely something I’m posting. I’m not posting, maybe I’m shooting a video today [Inaudible 00:10:03], but I’m not posting, not over-rotating too much on topics outside of my interest. My interest is for data engineers, machine learning engineers, and the data science community. That’s what I’m posting. I’m posting things here, and I’m also actively liking and commenting on others’ posts just to have that communication and have, make it not just a one-way conversation. That’s just some tips, and that’s just some ways that I’ve crafted my LinkedIn profile. I hope that you’ll go out and find me on LinkedIn. Let’s connect, and just build out your profile, and this gives you an opportunity to, as you’re looking and building out your profile, you can see some gaps. There’s some holes in areas that you need to shore up, whether it be in work experience, certifications, education, or just activity. If you have any questions, make sure you put them in the comments section here below. Go subscribe and ring that bell so you never miss an episode, and you’re always notified whenever we do an upload here on Big Data Big Questions.

[Sound effects]

Filed Under: Data Engineers, Video Tagged With: Branding, Data Engineer, LinkedIN, Social Media

Tableau For Data Science?

May 15, 2019 by Thomas Henson Leave a Comment

Big Data Big Questions

Tableau is huge for interacting with data and empower users to find insight in their data. So does this mean Tableau is the primary tool for Data Scientist? In this episode of Big Data Big Questions we tackle the question of “Is Tableau used for Data Science”.

Tableau For Data Science

What is Tableau

Tableau is a business intelligence software that allows for users to visualize and drill down into data. Data Users leverage Tableau highly for visualization portion of Data Science projects. The sources for data can be from databases, CSVs, or almost any source with structured data. So if Tableau is for analyzing and visualizing data is it a tool specific Data Scientist? Watch the video below to find out Tableau’s role in the world of Data Science.

Transcript – Tableau For Data Science?

Hi folks! Thomas Henson here with thomashenson.com, and today is another episode of Big Data Big Questions. Today’s question comes in from a user, and it’s around data science, and Tableau, and how those go together. But, before we jump into the question, if you have a question that you want to know about data engineering, IT, data science, anything related to IT, or just want to throw a question at me, put it in the comments section here below or reach out to me on Twitter at #BigDataBigQuestions. Or, thomashenson.com/big-questions. Ton of ways to get your questions here, answered right on this show, all you have to do is type away and ask.

Now, let’s jump into today’s question. Today’s question comes in from a YouTube viewer, and it’s about, hey, in data science, do you use Tableau? You can see the question here as it pertains to this, and so this is a question we started up this show doing, around data engineering, but now we’re really jumping towards, hey, what’s going on from a data science and just encompassing all of it? Today’s question, we’re going to talk about where’s Tableau used, right? A lot of people use Tableau. It’s really, really popular. But, is that really a tool that a data scientist is going to use? Should you invest your time as a data engineer or a data scientist aspiring or not aspiring to get into data science? Should you spend time learning about that tool?

My thoughts on Tableau are that it’s really good for giving information out to users that could be not necessarily data scientists. They could be users of it. They could be analysts. They could be somebody who just has a stake in their business. I’ve used it at a lot of different corporations that I’ve worked at, and companies, and companies, and organizations, and really what I see is those tools are more for the end user, for visualization. They may fall more in the data visualization bucket. We’ve talked about the three tiers of work. You have your data scientist, you have your data engineer, and your data visualization specialist, the person who’s making sure that, hey, at the end of the day, it’s great that we have all these algorithms that are showing us and being able to predict whatever we’re trying to look at in our data, but if we can’t sell that and can’t convey that to the people that need the data to make a decision on, then it’s just an experiment, it’s just us having fun doing research.

When it comes to an end product or being able to really sell your point, data visualization, I think that’s the bucket that Tableau fits in more than just traditional data science. Could be wrong. Let me know if I am here in the comments section below, but let me talk a little bit about my use case and where I’ve seen it. Like I said, I’ve used it in a lot of different organizations that I’ve worked with or even contracted with. One of the main use cases, I’ll give you an example. Let’s say that you’re a YouTube viewer. I’m not saying YouTube uses Tableau, this is just an example. I don’t want to give away too much information, insider. If you have a YouTube channel, think about if you want to see the videos that are coming in. You’re a user. You’re a publisher, a creator. You want to know. Here is all the videos that you have. Here’s how long they’re watched. Here’s all the demographics from behind the scenes that you can pull. Maybe the times that they were watched. How long they were watched, so on this video here, if people drop out after 30 seconds, I did something wrong there. Versus, how many people go through the end of it. Same thing, too. What you would do is, you would have all this information and aggregate all this data, and you maybe even pull some insights. Like, hey, what’s your average? We can do some real simple things, or you can do some complex things, too. Tableau is where you’re going to give the end user the access.

At least what I’ve seen a lot. There’s a big need to be able to do that and be able to pull that data. It gives you a way to, I wouldn’t say that a data scientist wouldn’t, per se, use that as their tool. It wouldn’t be their only tool. Maybe that’s the way that they aggregate and look at large amounts of data before they go in and start to pick and choose. I’m sure there’s some modules out there that are incorporating machine learning and deep learning. I will say, if you’re really looking from an AI perspective to jump into, it’s not just going to be about Tableau. I’m not saying that you shouldn’t get up to speed on Tableau, but I wouldn’t say that, hey, I’m a brand-new person graduating high school, graduating college, or somebody that sees it in their career and looking to go into data science, my choice would not be to jump in and learn Tableau. I would start learning a little bit more about Python, and algorithms, and maybe R, or some of the other higher-level languages to talk around machine learning and deep learning, versus saying, “Hey, this is the tool that’s going to kind of take me there.” Now, if you’re a data visualization person, or you want to get into big data from that perspective, there’s a lot of things that you can use Tableau to do. You might add it to your bucket. As far as we talk about on this show, how to accelerate your career or how to break into the big data realm, this is not one of those tools that I’m going to say, hey, this is the only choice you have. Not really going to be the one that’s probably going to make the more sense. It’s not going to be the game changer, like hey, this person’s certified in Tableau or is a Tableau wizard. If you’re applying for a job that’s all around Tableau then, definitely. As far as, I really want to get down into data science, and I really want to get deep in it, Tableau’s one of those things. Definitely probably going to use or come across tools that are similar to that, but it’s not going to be your mainstay, probably, where you’re writing your algorithms and doing your analytics.

That’s all for today. If you have any questions, make sure you put them in the comments section here below, and then make sure you click subscribe to follow this channel, so that you never miss an episode of Big Data Big Questions.

[Music]

Filed Under: Data Engineers, Video Tagged With: Big Data Big Questions, Data, Data Science

Installing And Configuring Splunk Course

April 29, 2019 by Thomas Henson Leave a Comment

Last month I released my 7th course at Pluralsight and first learning path course. Installing and Configuring Splunk is my second course in the world of Splunk. In this course I focus on understanding what it take to become a Splunk Architect. Since this is a learning path I get an opportunity to dive deep into Splunk.

Splunk is one of the hottest solutions in data analytics and is a great tool for Data Engineers. If you are looking to analyze log files or any type of machine generated data then Splunk offers the ability to quickly index and search data. This course is specially built for System Administrators, Data Engineers, or Data Enthusiasts to learn Splunk for the ground up.

installing and configuring splunk

What is Splunk

In the first part of the Installing and Configuring Splunk course we dig into the basics of Splunk. Not only do we cover what Machine Data but we also look at the history of Splunk. Finally we end the What is Splunk module by explaining the basics of the Splunk architecture. Next it’s time to walk through building out our development environment.

Installing Splunk

The second module we begin to work on building our Splunk development environments. First we setup a Splunk account so that we have access to the Splunk Enterprise downloads. Now we start installing Splunk in a Windows environment using the Splunk install wizard for Windows. Next we jump into the MacOS environment for installation and configuring on a Mac. Finally we end with installing Splunk on Linux from the command line.

Navigating Splunk

The last module in the Installing and Configuring Splunk course is all about navigating the Splunk development environments. We start by loading data from our local Windows environment to search through our machine log files. Next we explore Splunkbase for adding applications into our Splunk environments. Finally we end with a look ahead to the future courses in the Splunk Learning Path at Pluralsight.

Want More Data Engineering Tips?

Sign up for my newsletter to be sure and never miss a post or YouTube Episode of Big Data Big Question where I answer questions from the community about Data Engineering questions.


Filed Under: Splunk Tagged With: Analytics, Pluralsight, Splunk

Learning Tensorflow with TFLearn

February 11, 2019 by Thomas Henson Leave a Comment

Recently we have been talking a lot about Deep Learning and Tensorflow. In the last post I walked through how to build neural networks with Tensorflow . Now I want to shift gears to talk about my newest venture into Tensorflow with TFLearn. The lines between deep learning and Hadoop are blurring and data engineers need to understand the basics of deep learning. TFLearn offers an easy way to learn Tensorflow.

What is TFLearn?

TFLearn is an abstraction framework for Tensorflow. An abstraction framework is basically a higher level language for implementing lower level programming. A simple way to think of abstraction layers is it reduces code complexity. In the past we used Pig Latin to abstract away Java code for Tensorflow we will use TFLearn.

TFLearn offers a quick way for Data Engineers or Data Scientist to start building Tensorflow neural networks without having to go deep into Tensorflow. Neural Networks with TFLearn are still written in Python, but the code is drastically reduced from Python Tensorflow. Using TFLearn provides Data Engineers new to Tensorflow an easy way start learning and building their Deep Neural Networks (DNN).

Pluralsight Author

Since 2015 I’ve been creating Data Engineering courses through Pluralsight. My latest course on TFLearn titled Implementing Multi-layer Neural Networks with TFLearn is my sixth course on Pluralsight. While I’ve developed courses in the past this course was in two major areas: Implementing Multi-layer Neural Networks is my first course in the deep learning area. Second this course is solely based on coding in Python. Until now I had never done a coding course per say.

Implementing Multi-layer Neural Networks with TFLearn

Implementing Multi-layer Neural Networks with TFLearn is broken into 7 modules. I wanted to follow closely with the TLearn documentation for how the functions and layers are broken down. Here are the 7 modules I cover in Implementing Multi-layer Neural Networks with TFLearn:

  1. TFLearn Course Overview – Breakdown of what is covered in this course around deep learning, Tensorflow, and TFLearn.
  2. Why Deep Learning – Why do Data Engineers need to learn about deep learning? Deep dive into the basic terminology in deep learning and comparison of machine learning and deep learning.
  3. What is TFLearn? – First start off by defining TFLearn and abstraction layers in deep learning. Second we breakdown the differences between Tensorflow and TFLearn. Next we run through both the TFLearn and Tensorflow documentation. Finally we close out the module by building your TFlearn development environment on you machine or in the cloud.
  4. Implementing Layers in TFLearn – In deep learning layers are where the magic happens so this where we begin our Python TFLearn coding. In the first example we build out neural networks using the TFLearn core layers. Our second neural network we build will be a Covolutional Neural Network (CNN) with out MNIST data source. After running our CNN it’s time to build our 3 neural network with a Recurrent Neural Network (RNN). Finally we close out the module by looking at the Estimators layers in TFLearn.
  5. Building Activations in TFLearn  – The activations module give us time to examine what mathematical functions are being implemented at each layer. During this module we explore the different activiations available in Tensorflow and TFLearn.
  6. Managing Data with TFLearn – Deep learning is all about data sets and how we train our neural networks with those data sets. The Managing Data with TFLearn module is all about the tools available to handle our data sets. In the last topic area of the data module we cover the implications and tools for real-time processing with Tensorflow’s TFLearn.
  7. Running Models with TFLearn – The last module in the Implementing Multi-layer Neural Networks with TFLearn Pluralsight course in all about how to run models. During the course we have focused mainly on how to implement Deep Neural Networks (DNN) but in this module we introduce Generative Neural Networks (GNN). Finally after comparing DNNs and GNNs we look to the future of deep learning.

Honest Feedback Time

I would love some honest feedback on this course:

  • How did you like?
  • Would you like to see more deep learning courses?
  • What could be better?

Feel free to put these answers in the comment section below or send me an email.

Filed Under: Tensorflow Tagged With: Deep Learning, Pluralsight, Python, Tensorflow, TFlearn

Hello World Tensorflow – How This Data Engineer Got Started with Tensorflow

January 28, 2019 by Thomas Henson 2 Comments

My Tensorflow Journey

It all started last year when I accepted the challenge to take Andrew Ng’s Coursera Machine Learning Course with the Big Data Beard Team. Now here I am a year later with a new Pluralsight course diving into Tensorflow (Implementing Neural Networks with TFLearn) and writing a blog post about how to get started with Tensorflow. For years I have been involved on the Data Engineering side of Big Data Projects, but I thought it was time to take a journey to see what happens on the Data Science side of these projects. However, I will admit I didn’t start my Tensorflow journey just for the education, but I see an opportunity for those in the Hadoop ecosystem to start using the Deep Learning frameworks like Tensorflow in the near future. With all that being sad let’s jump in and learn how to get started with Tensorflow using Python!

What is Tensorflow

Tensorflow is a Deep Learning framework and the most popular one at this moment. Right now there are about 1432 contributors to Tensorflow compared to 653 Keras (which offers abstraction layer for Tensorflow) from it’s closet competitor. Deep learning is related to machine learning, but uses neural networks to analyze data. Mostly used for analyzing unstructured data like audio, video, or images. My favorite example is trying to identify cats vs. dogs in a photo. The machine learning approach would be to identify the different features like ears, fur, color, nose width, and etc. then write the model to analyze all the features. While this works it puts a lot of pressure on the developer to identify the correct features. Is the nose width really a good indicator for cats? The deep learning approach is to take the images (in this example labeled images) and allow the neural network to decide which features are important through simple trial and error. No guess work for the developer and the neural network decides which features are the most important.

Default
1
 

Source – KDNuggets Top 16 DL Frameworks
Tensorflow is open source now, but has it’s root from Google. The Google brain team actually developed Tensorflow for it’s use of deep learning with neural networks. After releasing a paper on disbelief (Tensorflow) Google released Tensorflow as open source in 2017. Seems eerily familiar to Hadoop except Tensorflow is written in C++ not Java but for our purposes it’s all Python. Enough background on Tensorflow let’s start writing a Tensorflow Hello World model.


How To Get Started with Tensorflow

Now that we understand about deep learning and Tensorflow we need to get the Tensorflow framework installed. In production environments GPUs are perferred but CPUs will work for our lab. There are a couple of different options for getting Tensorflow installed my biggest suggestion for Window user is use a Docker Image or an AWS deep learning AMI . However, if you are a Linux or Mac user it’s much easier to run a pip install. Below are the commands I used to install and run Tensorflow in my Mac.
$ bash commands for install tensorflow
using env

Always checkout the official documentation at Tensorflow.

Tensorflow Hello World MNIST

from __future__ import print_function
import tensorflow as tf

a = tf.constant(‘Hello Big Data Big Questions!’)

#always have to run session to initialize variables trust me 🙂
sess = tf.Session()

#print results
print(sess.run(a))

Beyond Tensorflow Hello World with MNIST

After building out a Tensorflow Hello World let’s build a model. Our Tensorflow journey will begin by using a neural network to recognize hand written digits. In the deep learning and machine learning world the famous Hello World is to use the MNIST data set to test out training models to identify hand written digits from 0 – 9.  There are thousands of examples on Github, text books, and on the official Tensorflow documentation. Let’s grab one of my favorite Github repo for Tensorflow by Americdamien.

Now as Data Engineers we need to focus on being able to run and execute this Hello World MNIST code. In a later post we can cover behind the code. Also I’ll show you how to use a Tensorflow Abstraction layer to reduce complexity.

First let’s save this code as mnist-example.py

“”” Neural Network.
A 2-Hidden Layers Fully Connected Neural Network (a.k.a Multilayer Perceptron)
implementation with TensorFlow. This example is using the MNIST database
of handwritten digits (http://yann.lecun.com/exdb/mnist/).
Links:
[MNIST Dataset](http://yann.lecun.com/exdb/mnist/).
Author: Aymeric Damien
Project: https://github.com/aymericdamien/TensorFlow-Examples/
“””

from __future__ import print_function

# Import MNIST data
from tensorflow.examples.tutorials.mnist import input_data
mnist = input_data.read_data_sets(“/tmp/data/”, one_hot=True)

import tensorflow as tf

# Parameters
learning_rate = 0.1
num_steps = 500
batch_size = 128
display_step = 100

# Network Parameters
n_hidden_1 = 256 # 1st layer number of neurons
n_hidden_2 = 256 # 2nd layer number of neurons
num_input = 784 # MNIST data input (img shape: 28*28)
num_classes = 10 # MNIST total classes (0-9 digits)

# tf Graph input
X = tf.placeholder(“float”, [None, num_input])
Y = tf.placeholder(“float”, [None, num_classes])

# Store layers weight & bias
weights = {
‘h1’: tf.Variable(tf.random_normal([num_input, n_hidden_1])),
‘h2’: tf.Variable(tf.random_normal([n_hidden_1, n_hidden_2])),
‘out’: tf.Variable(tf.random_normal([n_hidden_2, num_classes]))
}
biases = {
‘b1’: tf.Variable(tf.random_normal([n_hidden_1])),
‘b2’: tf.Variable(tf.random_normal([n_hidden_2])),
‘out’: tf.Variable(tf.random_normal([num_classes]))
}

# Create model
def neural_net(x):
# Hidden fully connected layer with 256 neurons
layer_1 = tf.add(tf.matmul(x, weights[‘h1’]), biases[‘b1’])
# Hidden fully connected layer with 256 neurons
layer_2 = tf.add(tf.matmul(layer_1, weights[‘h2’]), biases[‘b2’])
# Output fully connected layer with a neuron for each class
out_layer = tf.matmul(layer_2, weights[‘out’]) + biases[‘out’]
return out_layer

# Construct model
logits = neural_net(X)
prediction = tf.nn.softmax(logits)

# Define loss and optimizer
loss_op = tf.reduce_mean(tf.nn.softmax_cross_entropy_with_logits(
logits=logits, labels=Y))
optimizer = tf.train.AdamOptimizer(learning_rate=learning_rate)
train_op = optimizer.minimize(loss_op)

# Evaluate model
correct_pred = tf.equal(tf.argmax(prediction, 1), tf.argmax(Y, 1))
accuracy = tf.reduce_mean(tf.cast(correct_pred, tf.float32))

# Initialize the variables (i.e. assign their default value)
init = tf.global_variables_initializer()

# Start training
with tf.Session() as sess:

# Run the initializer
sess.run(init)

for step in range(1, num_steps+1):
batch_x, batch_y = mnist.train.next_batch(batch_size)
# Run optimization op (backprop)
sess.run(train_op, feed_dict={X: batch_x, Y: batch_y})
if step % display_step == 0 or step == 1:
# Calculate batch loss and accuracy
loss, acc = sess.run([loss_op, accuracy], feed_dict={X: batch_x,
Y: batch_y})
print(“Step ” + str(step) + “, Minibatch Loss= ” + \
“{:.4f}”.format(loss) + “, Training Accuracy= ” + \
“{:.3f}”.format(acc))

print(“Optimization Finished!”)

# Calculate accuracy for MNIST test images
print(“Testing Accuracy:”, \
sess.run(accuracy, feed_dict={X: mnist.test.images,
Y: mnist.test.labels}))

Next let’s run our MNIST example

$ python mnist-example.py

…results will begin to appear here…

Finally we have our results. We get a 81% accuracy using the sample MNIST code. Now we could better and get closer to 99%  with some tuning or adding different layers but for our first data model in Tensorflow this is great. In fact in my Implementing Neural Networks with TFLearn course we walk through how to use less lines of code and get better accuracy.

tensorflow hello world mnist

Learn More Data Engineering Tips

Sign up for my newsletter to be sure and never miss a post or YouTube Episode of Big Data Big Question where I answer questions from the community about Data Engineering questions.

Filed Under: Tensorflow Tagged With: Deep Learning, Machine Learning, Python, Tensorflow

DynamoDB Index Tutorial

January 17, 2019 by Thomas Henson Leave a Comment